Analyzing a memory dump or (Memory Dump Analysis) can feel like peering into the soul of a system. It reveals everything the system was doing when the snapshot was taken. Understanding memory dumps is valuable if you’re a digital forensics professional, malware analyst, or cybersecurity student. Volatility 3 is one of the most essential tools for memory analysis. This article walks you through the first steps using Volatility 3, including basic commands and plugins like imageinfo, pslist, and more.
Starting with a Memory Dump
Before digging into plugins, make sure you have a valid memory dump and Volatility3 loaded. Volatility3 is the most recent version of the popular memory analysis tool, developed in Python 3 and featuring a modular plugin architecture. Unlike Volatility2, Volatility3 does not rely on “profiles” similarly but uses a more dynamic layer and symbol table model.
Place your memory dump in a known location and make note of the path. All commands in Volatility3 are executed via the command line, typically like so:
python3 vol.py -f /path/to/memdump.raw plugin_nameIdentifying Image Type and OS
Your first task is to identify the type of image and the operating system it was taken from. This is where `imageinfo` comes in handy.
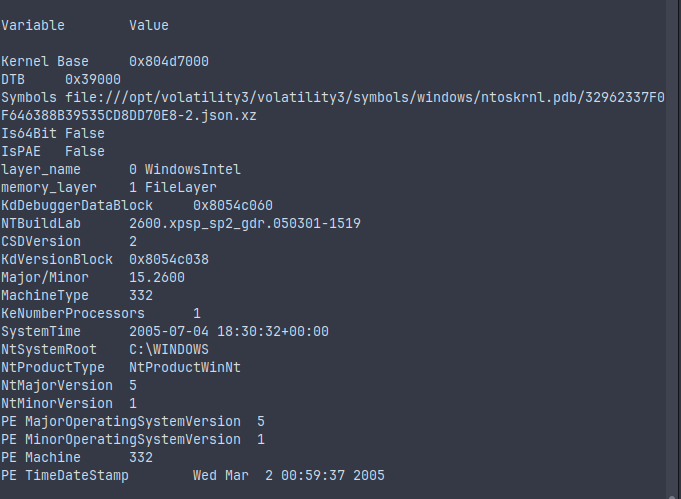
python3 vol.py -f xp-laptop-2005-07-04-1430.img windows.info
This command replaces the older imageinfo plugin in Volatility2. The output provides information like the kernel base, symbol table, and OS version. From here, you can identify the OS from which the dump was taken, which is critical to choosing the right plugins and interpreting the data correctly.
Exploring Basic Plugins (pslist, pstree, modules)
Once the OS is identified, you can begin running fundamental analysis plugins. These are the first steps in understanding what was going on in the system.
- pslist
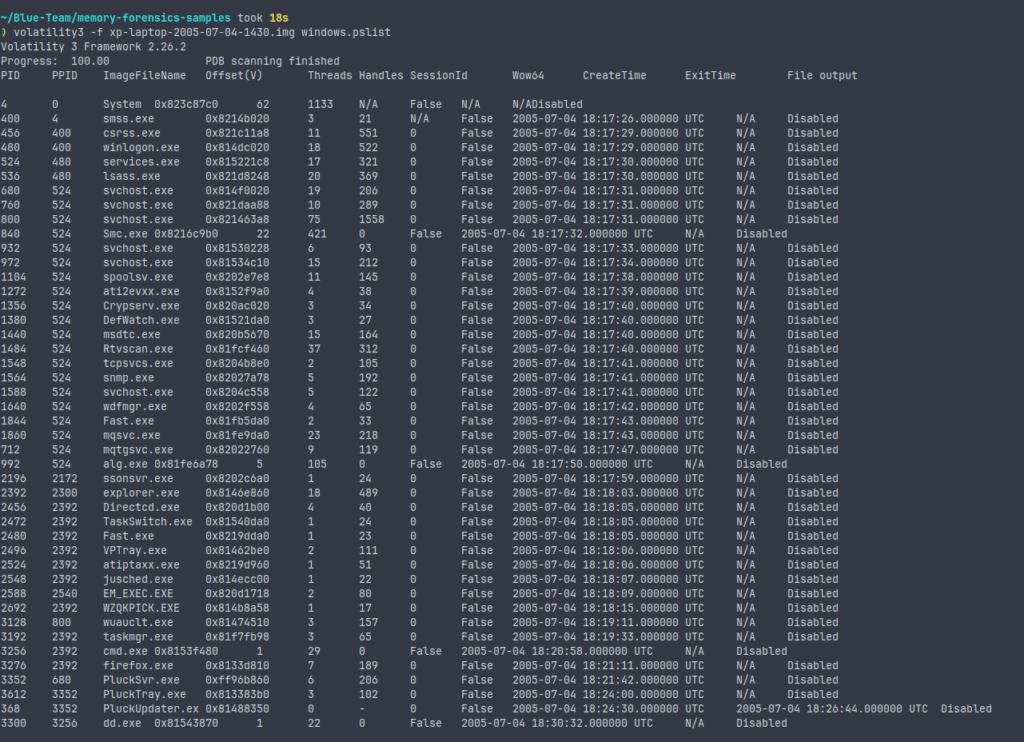
python3 vol.py -f memdump.raw windows.pslist
pslist enumerates active processes using a method that walks the _EPROCESS structures. It gives you details like process IDs, parent process IDs, thread count, and creation times. This is fundamental to building a timeline of system activity.
- pstree
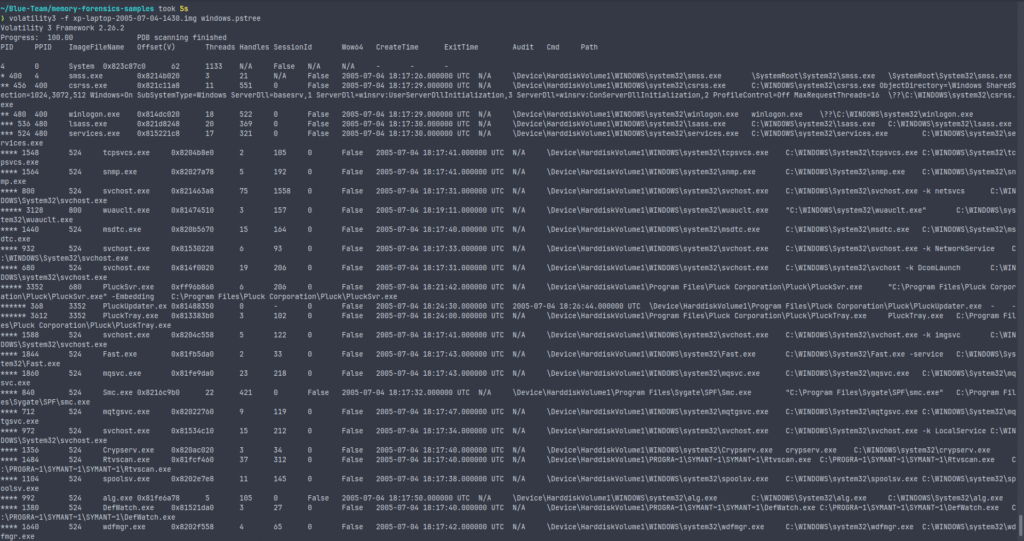
python3 vol.py -f memdump.raw windows.pstree
pstree provides a hierarchical view of running processes, making it easier to spot anomalies in parent-child relationships.
- modules
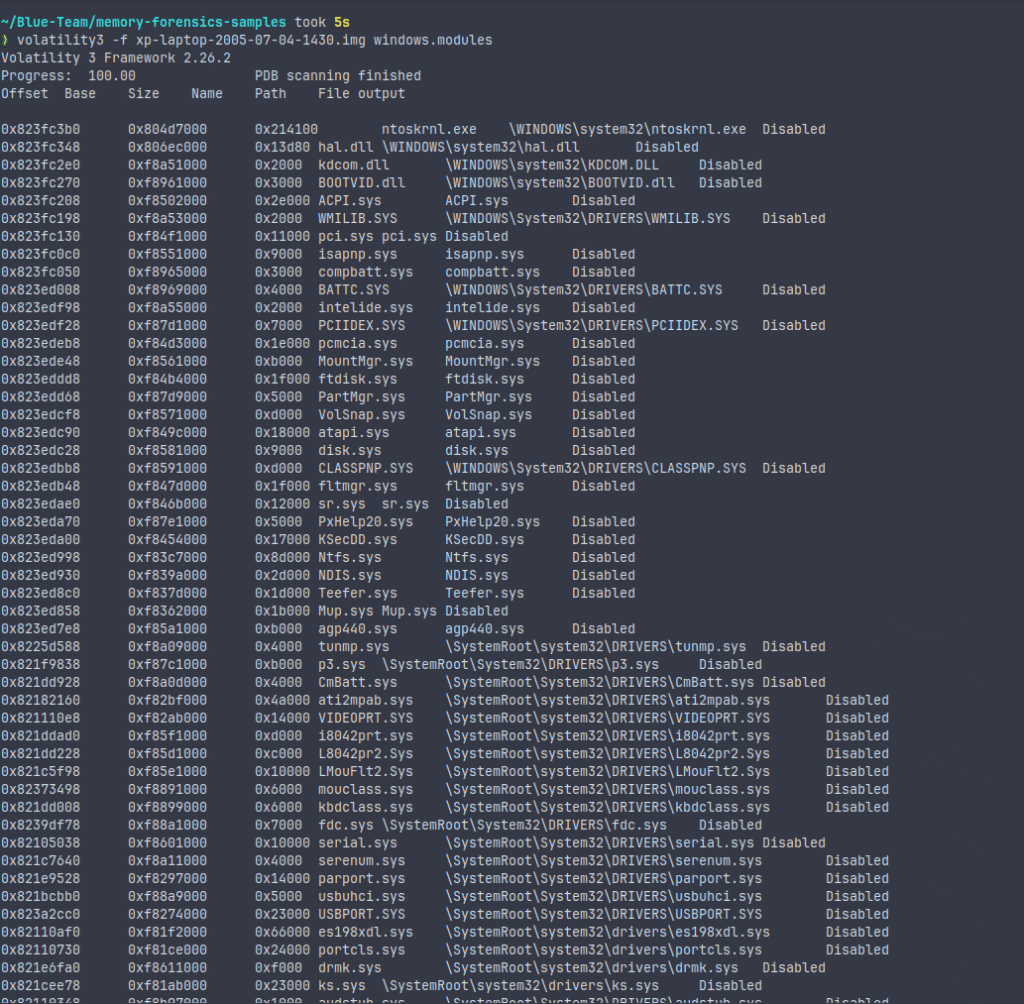
python3 vol.py -f memdump.raw windows.modules
This plugin shows you the kernel modules loaded during the dump. Suspicious or unrecognized modules could indicate rootkits or low-level malware.
Understanding Plugin Output
Understanding plugin output is about reading data and interpreting it in context.
- If
pslistshows a process that isn’t listed inpstree, it might be a sign of a hidden or injected process. modulesoutput should be cross-verified with known good lists of kernel modules.- Pay attention to timestamps and compare them to the system’s expected activity patterns.
Volatility3 outputs data in a structured table format, which can be piped into tools like grep or awk or redirected into a file for further analysis.
Comparing Output with OS Artifacts
Volatility3’s plugin output becomes more useful when compared against OS artifacts or known baselines.
- Compare
pslistresults with the Task Manager snapshot (if available). - Use the
modulesoutput and compare it to known clean boot modules for the same OS version. - Cross-reference timestamps with log files if they are accessible.
Corroboration is key in real forensic investigations. Memory analysis alone can indicate suspicious activity, but verifying it against disk, logs, and network traffic makes your findings credible.
Common Pitfalls and Troubleshooting Tips
Memory analysis isn’t always straightforward. Here are some common issues and how to troubleshoot them:
- Invalid Layers
If Volatility3 can’t identify a valid layer or fails to parse the image:
- Make sure you’re using the correct symbol table.
- Try using the
-vvverbose flag for more detailed errors.
- Plugin Fails Silently
Sometimes plugins return no output, not even an error.
- Check if the plugin is compatible with the OS version.
- Use `windows.info` to double-check the OS and layer configuration.
- Corrupted Memory Dump
A corrupted or incomplete dump can cause all sorts of issues.
- Verify file integrity before analysis.
- Try opening it with another tool to see if the corruption is tool-specific.
- Symbol Table Mismatch
Symbol tables must match the OS version exactly.
- Use Volatility3’s automatic symbol resolution if possible.
- Otherwise, you may need to manually point to the correct symbol file.
Summing Up
The art of memory dump analysis begins with knowing the fundamentals, and Volatility3 makes that process more contemporary and versatile than ever. Begin with recognizing the image, then go on to the fundamental plugins and carefully understand the results. Like any investigative tool, the insights you get depend on your approach, curiosity, and critical thinking. Keep practicing with different memory dumps and expand into advanced plugins as your skills grow.
Memory never lies—you just need to know how to read it.
Resources
Updated Volatility Foundation’s Memory Samples


